Category Archives: Lecture

The future of wearable devices on site

A scenario technique approach to the use of wearable devices by tourists at the destination

by Diana Fernanda Ortiz Rincon, Ashan Sasitha Abeyra and Eleonora Tommasini

Introduction

In the last few years mobile devices such smartphones and tablets have played a central role in our everyday life. Regarding the tourism industry they also contribute noticeably to the tourist’s experience, addressing not only the inspiration and planning stage, but also the experience on-site (Benckendorf et al., 2014). However, wearable devices are considered to be the technology of the future, which will definitely change the way people experience their surroundings.

Wearables are described by Jhajharia et al. (2014) as a device that becomes one with accessories and clothes and therefore can be easily worn by people. It can take various shapes that range from a wristband, a watch, to a pair of glasses that engage with the surroundings.

Today personal technologies are becoming more wearable, implying potential changes in the way users interact with technology and with each other (Tussyadiah, 2013). Relevant for the field is the research of Ihde (1990) about “non‐neutrality of technology-mediated experiences”, which states that technologies are set between humans and the world and therefore they can change human experiences, enhancing some aspects or reducing others. According to Ihde (1990), through embodiment, technologies will be to extend the sense perception of the users, giving the opportunity to conduct many activities at the same time, such as watching an attraction while accessing to different information (Tussyadiah, 2013). An important research in the field of wearable devices and tourism experience has been conducted by Tussyadiah (2013), who identified through a content analysis five categories representing patterns of motivation to use Google Glass as wearable devices for travel- related experiences.

Choudhary, Bhag & Walia (2014) argue that while wearable technology will not be replacing smartphones any time soon, and likely will not be widely used for years to come, the future is bright for this industry. Therefore, understanding the future implications of wearable devices and their impact on the tourism industry and consequently on the tourist behavior is a necessity.

The goal of this study is to determine the possible future scenarios of the use of wearable devices by tourists on site, by focusing on two types of wearable technology: smart glasses and smart watches, devices that facilitate practical functions including communication, navigation, health monitoring, fitness tracking and augmented reality. In addition, this research also aims to bring a meaningful contribution to the existing literature regarding the future of the wearable devices used by tourists on site and its effects on tourist behaviour.

Methodology

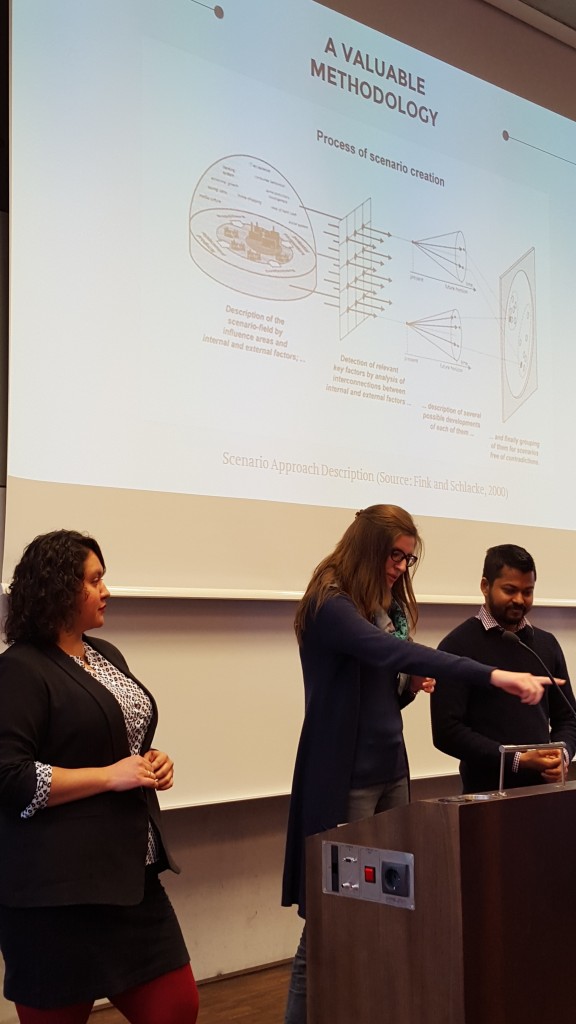
When it comes to determine future development of a particular issue, the scenario approach is described as one of the most useful tools among the future research methodologies, because of its ability to consider a wider range of possibilities and possible future directions otherwise ignored (Shoemaker, 1995). This methodology is a scientific but at the same time creative process that aims at generating an array of scenarios based on possible future developments of the variables that build the system (Fink & Schlake, 2000).

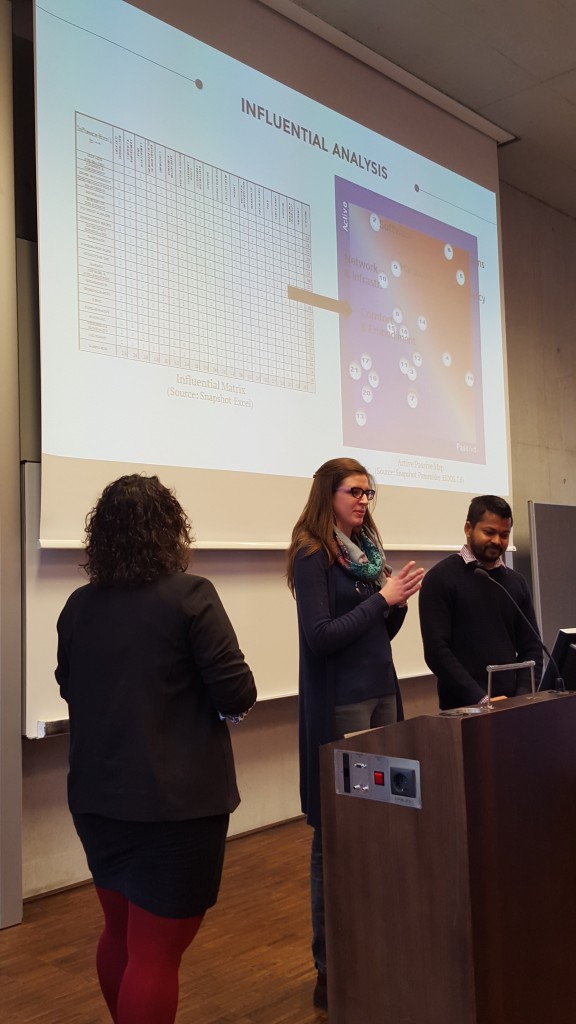
Starting point of the scenario approach is the assessment of the most influential and critical factors through a structural analysis, in order to be able to identify factors part of the base scenario (Godet & Meunier, 1999). As the literature suggests, these variables can be identified through a team process that stimulates creativity thinking, an open exchange of ideas (Fink & Schlake, 2000; Godet & Meunier, 1999) and contribute in reducing the degree of subjectivity (De Jouvenel, 2000). For this reason, one of the most suitable method for the data collection was identified in the focus group practice, due to its ability to raise different opinions from the presence of members with diverse values and believes (Van der Heijden et al., 2002). The organized focus group saw the participation of 10 master students of the Salzburg University Of Applied Sciences, with good understanding of technology in tourism, since it is highly advisable to address somebody that possess adequate knowledge of the issue and might also be involved in the system (Godet & Meunier, 1999). Within this context, the PESTEL analysis provided a good framework to support the formulation of questions that covered different sphere of impact of wearable devices, in order to generate a more comprehensive array of factors that form the base scenario (Van der Heijden, 2002). Finally, 21 different factors were identified and rated pairwise following the order from the y-axis to the x-axis, according to a scale from 0, absence to 3, strong influence (Schüll & Schröter, 2013).

From these 21 factors the research team conducted the following observations:

  • Software (2) and Hardware (9), Network and Infrastructure (10), Comfort and Embodiment (8) are active or also named influential factors (1st quarter). These factors, especially the first three, influence the system much more strongly than they are influenced.
  • Functions and Usages (5), Dependency (6) and partially 3rd Party Information (14) are critical, dynamic or relay factors (2nd quarter). These variables are very influential and at the same time very dependent on the others.
  • Experience Enhancement (4) and Crisis Management (16) are reactive but passive factors (4th quarter): they are influenced more strongly than they act on the others.
  • All the remaining factors are falling in the 3rd quarter of the map and are the so called buffering, excluded or lazy factors. They have a low influence and low dependency, with major concern to the ones falling in the lower side. Among the excluded factors for their quite passive tendency we find Terrorism and Criminality, Use permit, Legality of Use, Dependence on Smartphone and to some extent Market, which has been employed in the scenario description to address the level of competition, in connection with the price variable.

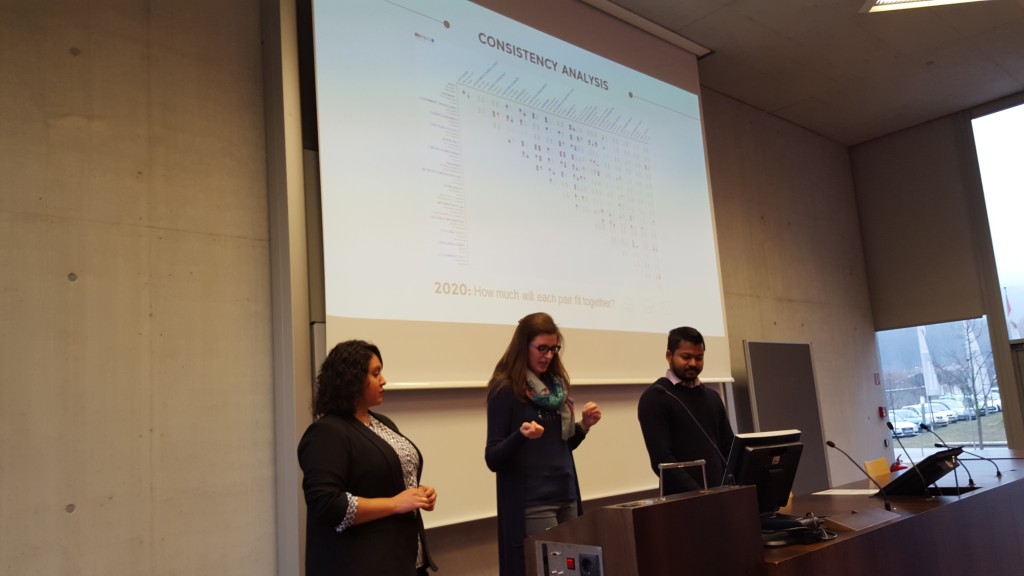
The following step saw the conduction of a morphological analysis which saw the listing of two or more future alternatives for each factor and a consecutive consistency analysis. For many factors the researchers provided two manifestations according to a future situation that is rather stable and unchanged and its possible further development, e.g. referring to the hardware, it was assumed to either face an increase in capabilities or to maintain the same ones as current. In order to identify how well two different developments could suit together in the future, the research team proceeded with the attribution of a contingency rate.  The ratings were attributed considering the likelihood of a pair manifestation in a time lapse of 5 years, based also on the opinions and the issues raised by the focus group participants. With the fulfilment of the consistency matrix, the software calculated all the possible combination that could be generated by combining all the different manifestations.

Fundamental for the scenario selection is its degree of plausibility and consistency (Van der Heijden et al., 2002). Generally the uncertainty of a future development depends on the number of possibilities that are generated: the more outcomes, the greater the uncertainty. Within this case it was therefore advisable to apply a more flexible strategy for the scenario selection, in order to assess a major number of  choices (Godet, 2000). Therefore, the adopted strategy took into consideration four different scenarios according to a best, a worst and a surprise-free case (Schüll & Schröter, 2013), based on the driving forces previously identified in the structural analysis as  most active and independent factors on the first quarter of the matrix (Van der Heijden et al., 2002).

Findings

Within the frame of the use of wearable devices by tourists on site the research shows that software, hardware, network & infrastructure and comfort & embodiment are the most influential and independent factors. In addition, variables such as functions & usages, dependency and access to information by third parties, were identified as critical, very influential but also highly dependent on other factors.

The four scenarios presented aim at providing an overview of possible future situations concerning the use of wearable devices by tourists on a destination. The first and the last scenarios have the highest consistency rate and are therefore the most plausible, based on the ratings assigned in the structural and morphological analysis. Both scenarios are actually based on the assumption that software and hardware of wearables will undergo further development, becoming more functional, sophisticated with a higher degree of comfortability, together with the improvement of network and infrastructure that provide internet access to those devices. For instance, the European Union claimed the abolishment of extra roaming fees by 2017 for all its countries, enabling its citizens to call, send messages and surf benefitting from the same tariffs also when abroad (European Commission, 2016). Based on this statement and the currently development of these technologies, there is a higher probability that the future use of wearable devices on site might reflect part of these aspects. The two scenarios are shaped starting from quite similar influential future developments. However, the third party access to private information plays a big role in their differentiation: while in the Awesome Scenario wearables pose no major threat to privacy and protection of private information, the Evil Scenario presents a possible future where the use of wearables facilitates a permanent intrusive access and acquisition of personal private information by third parties through software and social networks.

The scenarios Meh and Grumpy on the other side, present lower consistency rates. This indicates a reduced degree of credibility and are developed on the assumption that software and hardware of wearables will not undergo major further developments, but rather maintain their current features. Also the future projection addressing network and infrastructures indicates an unchanged situation, without any further improvements regarding Wi-Fi coverage or the availability of more convenient roaming possibilities. On one side, we find the Meh Scenario picturing a rather unchanged situation where the majority of the tourists are still using their smartphones while on site: even though being comfortable to use, the limited possibilities offered by wearables contributes to a limited adoption only by an elite of tourists, who are either more technology oriented, or take advantage of the possibility to keep track of their health conditions. On the other side, the Grumpy Scenario portrays a situation, where wearable devices fail to provide tourists an overall experience enhancement, due to its reduced functionality and a high degree of discomfort while wearing them. Moreover, it will result on tourists’ dissatisfaction when using wearables as they will be paying a premium price for functions that are already available in other devices.

Conclusion

Wearable devices are gaining popularity around the world in both personal and business usage across many fields. In tourism sector, these devices are expected to have an effect on how a tourist would look, communicate and interact with their environment in the future. This study was conducted using the scenario technique in order to identify future possibilities of the use of wearable devices by tourists on site. Out of a vast number of possible scenarios generated, the four scenarios chosen and described:  Awesome, Meh, Grumpy and Evil depict future instances within highest and lowest consistency rates, offering the reader an overview on four extreme possible scenarios at different degrees of plausibility.

As noted earlier, wearable devices are still at an early adopter stage in terms of public and commercial use. However, as the famous Greek philosopher Seneca claimed: “if one does not know to which port one is sailing, no wind is favourable”, the researchers aimed at assessing a wider range of possible directions that the development of wearable devices might follow in the near future.

2016-02-29 10.12.11

2016-02-29 10.10.05 2016-02-29 10.06.13

References

Benckendorf, P. J., et. al (2014). Tourism Information Technology, Cabi Tourism Texts, Wallingford, UK.

De Jouvenel, H. (2000). A Brief Methodological Guide to Scenario Building. Technological Forecasting and Social Change, 65, 37–48.

European Commission (2016). Roaming Tariffs. Retrieved January 2016 from https://ec.europa.eu/digital-single-market/roaming-tariffs

Fink, A., & Schlake, O. (2000). Scenario management—An approach for strategic foresight. Competitive Intelligence Review, 11, 37–45.

Godet, M. (2000). The Art of Scenarios and Strategic Planning. Technological Forecasting and Social Change, 65(1), 3–22.

Godet, M., & Meunier, F. (1999). Structural Analysis. Futures Research Methodology—V3.0, 0–48.

Ihde, D. (1990). Technology and the Lifeworld: From Garden to Earth. Bloomington, University Press, Indiana, USA.

Jhajharia S., Pal S.K. and Verma S. (2014) Wearable Computing and its Application. International Journal of Computer Science and Information Technologies, 5 (4), 5700-5704.

Schüll, A. E., & Schröter, W. (2013). Guideline for the performance of participatory scenario processes in INTEGRAL.

Shoemaker, P. J. H. (1995). Scenario Planning : A Tool for Strategic Thinking. Sloan Management Review, 36, 25–40.

Tussyadiah, I., (2013). Expectation of Travel Experiences with Wearable Computing Devices. Information and Communication Technologies in Tourism 2014: Proceedings of the International Conference in Dublin, 539-552.

Van der Heijden, K. (2002). The Sixth sense: accelerating organizational learning with scenarios.

Enhancing Online Experience: How Storytelling Triggers Emotions

by Kimberly Abeng, Rene Lule, Brian Yerri and Zhamilya Zhukenova

1. INTRODUCTION

The internet affected tourism industry structure (Poon 1993; Sheldon 1997) in a way that rivalry among the existing competitors increased, while on the demand side, the internet introduced a much higher degree of transparency as well as lowering the switching costs (Porter, 1985). The internet empowered consumers or tourists to easily identify, customise and purchase tourism products (Buhalis & Law, 2008, p. 610). Due to the rich content from the Internet and increasing of online users, printed media and television advertisement are no longer able to persuade consumers who search for deeper and meaningful experience. This factor has caused an inadequacy in the traditional marketing approach (Hosany and Witham, 2009) as consumers are in search of experiences that dazzle their senses, engage them personally, touch their hearts and stimulate their minds (Schmitt, 1999).

Tourists’ experience has become an important topic in the tourism business as well as in the field of tourism research (Uriely, 2005) and for this reason it is vital for destinations to understand the issue of tourism experiences as that is what travellers are searching for (Neuhofer et al., 2012). Furthermore, not just “experience”, but “virtual experience” now considered as even more important for tourism industry, since online media is the main channel of informing potential customers of touristic products and offers nowadays (Eisenloeffel, 2013).

Consequently, this study seeks to investigate storytelling as a tool of enhancing online experience by triggering emotions and hence being the right instrument to use for tourism product providers.

1.1 Storytelling

The role of storytelling in tourism is looked at in different ways; the story “transforms an otherwise indifferent space into attractive tourist destinations” (Chronis, 2012, p. 445). The success of narrative presentation in tourism depends on the willingness and involvement of tourists who have this ability to participate actively in a storytelling experience as well as being co- creators of the tourism experience.

Storytelling offers individuals a means of escape as they try to take in the accounts and explanations embedded within, and therefore it can be said that tourism experiences have the ability to attain a symbolic status in lives of the tourists, as they create their worlds into a bigger picture through actions, attitudes and values (McCabe & Foster, 2008, p.195).

Destinations can be seen as storyscapes or business domains where narratives can be arranged and transformed through an interaction between the suppliers or producers and customers (Chronis, 2005).

Figure 2. Wheel of Emotions. Source: Plutchik (2001).

1.2 Emotions

Being of such a high importance in our lives, emotions become the main target of marketing and advertisement strategies, as well as design strategies of products and services, since the buying decisions may be driven by emotions (Desmet, 2003). In relation to tourism, according to Kim & Fesenmaier (2014) “emotions play a pivotal role in shaping tourism experiences” (p. 1). Roseman, Spindle, and Jose (1990, p. 899), define emotions as “evaluations and interpretations of events, rather than events per se, [that] determine whether an emotion will be felt and which emotion it will be.” Scherer (1987) goes deeper and defines emotions as “an episode of interrelated, synchronised changes in the states of all or most of the five organismic subsystems in response to the evaluation of an external or internal stimulus event as relevant to major concerns of the organism” (p. 7). The stimulus event can be both external (good or bad news) and internal (dreaming).

2. METHODS

With the purpose of designing a robust and valid study, the researchers considered experiment to be the best research design. Furthermore, according to Berg (2000) greater research validity can be attained via recourse to triangulation. Therefore the methodological triangulation is applied and the qualitative part of the study is represented by the focus group.

The two hypotheses to be tested are:

H1: Storytelling triggers emotions

H2: The emotions triggered have an effect on webpage/online experience

In order to test H1 it is needed to study the correlation between the storytelling and emotions, the latter has to be measured in order to reveal the correlation. Limited by resources, researchers determined the self-report method of emotions measurement as the most appropriate. Withal, emotions measurement was built on the model by Plutchik (2001), where he systematised the primary emotions in a “wheel” (Figure 2). Namely, the eight primary emotions are contrasted to each other: joy-sadness, trust-disgust, fear-anger, surprise-anticipation. In order to measure experienced emotions, the 7-point Likert scale was used with the emotion pairs being at the extreme points of the scale. The H2 is tested by the correlation of satisfaction level with emotions, since studies by Babin & Griffin (1998) and Oliver (1997) as cited in Prayag et al. (2013) reveal that a positively perceived consumption experience results in satisfaction.

Figure 2. Wheel of Emotions. Source: Plutchik (2001).

Then, the researchers have adopted a webpage of the DMO of Land Salzburg, Austria. The webpage was elaborated in four versions employing two themes with a story and a non-story element – video. The four videos employed in the study were selected from the total of eight videos, while the selection of videos and their designation to “story” or “non-story” category was made by twelve independent persons. Table 2 summarises the research approach of the current study as well as QR codes provide with direct link to the webpages and videos.

The quantitative part of the study employed the online self-completion questionnaires, where the respondents were asked to visit the adopted webpage of Salzburgerland Tourismus and to watch a video, after which they were asked to answer the questions. Within the qualitative framework, the focus groups were demonstrated the webpages of Salzburgerland Tourismus with both story and non-story videos. After that participants had a discussion of the videos and their emotional appeal.

Table 2. The research design.

2.1 Sample size and selection

The study used convenience sampling with university students as research subjects due to their availability and easy accessibility, a point also put forward by Bryman (2012) when explaining the choice of this type of sampling method.

An age range of between 18 – 35 years old was used considering the average age of students joining the university. The study stretches the minimum and maximum ages to 18 and 35 years respectively in order to cover the early and late beginners who are mainly working students (Pechar and  Wroblewski, 2012).

The use of university student samples in experimental research has increased in the hospitality and tourism (Ok et al, 2008), as well as in the social psychology and consumer behaviour sectors. According Lynch (1982), the traits exhibited by students as research subjects are similar. In other words, the difference displayed by students within a scale is less and also more consistent across scales than that displayed by non-students (Peterson, 2001). This small variation displayed by student groups due to their homogeneity may transform into stronger hypothesis tests as compared to that in non-student groups (Peterson, 2001; Lynch, 1982).

Concerning the sample size, according to Ding, Velicer and Harlow (1995) (cited in Schumacker & Lomax, 2010) the agreed minimum of sample size structural equation modelling is 100 to 150 subjects. Hair et al. (1977) as cited by Sirakaya-Turk et al. (2011) argues that the sample size of 200 is sufficient for well-grounded estimation.

In this research, it has been decided to use a sample size of 200 participants. Limited time and resources of the research team do not allow increasing the sample size, while this figure still provides sound foundation for the study.

The size of the focus groups was defined as 6 persons per group. Although Morgan (1998a) as cited by Bryman (2004) argues that common size of focus groups is from 6 to 10 participants, he still suggests smaller groups in cases when higher members’ feedback on the topic needed.

3. FINDINGS

3.1 Experiment

In order to find out from the data collected whether the story videos triggered emotions, frequency tables were drawn and the results indicated that over 90% of the respondents felt emotions after watching story videos, while 52% and 30% felt emotions after watching the children’s and skiing holiday non stories respectively. It can, therefore, be said that the story videos triggered more emotions than the non-story videos.

In order to capture the views of all the respondents to the study, cross tabulations were made on whether one felt emotions and feelings towards the webpage and video, and feelings about the experience on the webpage and video. The correlation coefficient returned positive relationships, which indicate that the emotions felt had an influence on the respondents’ feelings and experience on the webpage. The video duration and feelings towards the webpage and video produced a weak positive relationship, which could imply that the length of the video had a minimal effect on the feelings towards the webpage and video. But when video duration was again cross tabulated with feelings about the experience on the webpage, the relationships produced was stronger than in the first instance.

3.2 Focus group

Each of the two focus groups was transcribed, coded and analysed by two researchers, so that the decisions about importance of certain issues would not be biased by opinion of one researcher. Table 3 presents the findings from both focus groups.

During the focus group interview, it appears that both story videos were perceived with positive emotions, compared to the other two non-story videos, which is due to the video content providing a good storyline, music. Respondents reported feeling of involvement and excitement. Creating a good video content able to assist online users in decision making and music play important role for emotion appeal. Therefore, a good camera perspective, high video quality and embedded with the right music are important components for first impression.

In contrast, the non-story videos were perceived negatively due to the video content being narrative and informative. Respondents also found this video is extremely boring due to the poor video quality, bad audio and longer perceived duration even though it has the same length as the story videos. They also added that these videos would not be their first choice when comes to searching holidays information.

4. CONCLUSION

This study contributes to understanding of how online experience can be enhanced by storytelling through triggering emotions. The emotions felt by participants were tested with reference to Plutchik’s wheel of emotions (2001) and in relation to the output data collected, it was evident that storytelling does have an effect on emotions which in turn have an influence on users’ online experience. In addition, the study discovered a significant positive correlation between video content and the feelings about the experience on the webpage and video. Most of the respondents who found the video content interesting expressed satisfaction with the webpage and had a good experience as well.

The study also found that online users would prefer to watch a video first, which gives them the interest to seek more information about a destination by reading text stories. Other factors influencing the online experience include websites design, colours, font, and easy navigation.

From the findings of the study it is evident that storytelling aids in triggering awareness and an imagination, it also triggers interest and desire, which all support destination image and its promotion. Room for further research would however be to find out how destinations can convert this already generated awareness, imagination, interest and desire into action at the bottom of the purchase funnel.

2016-02-29 11.08.50 2016-02-29 11.09.19

5. REFERENCES

Berg, B., 2000. Qualitative Research Methods for the Social Sciences. 4th ed. Boston: Allyn & Bacon.

Bryman, A., 2004. Social Research Methods. 2nd edition. Oxford: Oxford University Press

Bryman, A., 2012. Social Research Methods. 4th edition. New York: Oxford University Press.

Buhalis, D., & Law, R., 2008. Progress in information technology and tourism management: 20 years on and 10 years after the Internet—The state of eTourism research. Tourism management, 29(4), pp.609-623.

Business Insider, 2013. The Mobile Tourist: How Smartphones Are Shaking Up The Travel Market. [Online]. Available at: <http://www.businessinsider.com/the-mobile-tourist-how-smartphones-are-shaking-up-the-travel-market-2013-1?IR=T> [Accessed on 31 January 2013].

Chronis, A., 2005. Co-constructing heritage at the Gettysburg storyscape. Annals of tourism research, 32(2), pp.386-406.

Chronis, A., 2012. Tourists as Story-Builders: Narrative Construction at a Heritage Museum. Journal of Travel & Tourism Marketing, 29 (5), pp. 444-459.

Desmet, P., 2003. Measuring Emotions: Development and Application of an Instrument to Measure Emotional Responses to Products. In: Blythe, M.A., Overbeeke, K., Monk, A.F., Wright, P.C., eds. 2003. Funology: From usability to enjoyment. Springer Netherlands. pp.111-123.

Eisenloeffel, J., 2013. Principles of Imagineering: A Conceptual Framework to Enhance Virtual Experience on Touristic Websites. MA. Salzburg University of Applied Sciences.

Hosany, S., & Witham, M., 2009. Dimensions of cruisers’ experiences, satisfaction, and intention to recommend. Journal of Travel Research, 49(3), pp.351-364

Kim, J., Fesenmaier, D. R., 2013. Measuring Emotions in Real Time: Implications for Tourism Design. In: Xiang Z., Tussyadiah I., Proceedings of the Information and Communication Technologies in Tourism, Dublin, January 2014. Switzerland: Springer.

Lynch Jr, J. G., 1982. On the external validity of experiments in consumer research. Journal of consumer Research, 9 (3), pp.225-239.

McCabe, S., and Foster, C., 2006 .The role and function of narrative in tourist interaction. Journal of tourism and cultural change, 4 (3), pp. 194-215.

Neuhofer, B., Buhalis, D., Ladkin, A., 2012. Conceptualising technology enhanced destination experiences. Journal of Destination Marketing & Management, 1(1–2), pp.36-46.

Ok, C., Shanklin, C. W., Back, K. J., 2008. Generalizing survey results from student samples: implications from service recovery research. Journal of quality assurance in hospitality & tourism, 8(4), pp.1-23.

Pechar, H., Wroblewski, A., 2012. Austria. Non-traditional students in the 2000s. In: Slowey, Maria/Schuetze, Hans G ed. 2012. Global Perspectives in Higher Education and Lifelong Learning. London/New York: Routledge. pp.25-42.

Peterson, R. A., 2001. On the use of college students in social science research: Insights from a second‐order meta‐analysis. Journal of consumer research, 28(3), pp.450-461.

Plutchik, R., 2001. The nature of emotions: Human emotions have deep evolutionary roots. American Scientist, 89, pp.344-350.

Poon, A., 1993. Tourism, technology and competitive strategies. Wallingford: CAB international.

Porter, M. E., 1985. Technology and competitive advantage. Journal of business strategy, 5(3), pp.60-78.

Porter, M. E., 2001. Strategy and the Internet. Harvard business review, 79 (3), pp. 62-79.

Prayag, G., Hosany, S., Odeh, K., 2013. The role of tourists’ emotional experiences and satisfaction in understanding behavioral intentions. Journal of Destination Marketing & Management, 2(2), pp.118-127.

Roseman, I. J., Spindle, M. S., & Jose, P. E., 1990. Appraisals of emotion-eliciting events: Testing a theory of discrete emotions. Journal of Personality and Social Psychology, 59(3), pp.899–915.

Scherer, K. R., 1987. Toward a Dynamic Theory of Emotion: The Component Process Model of Affective States. Geneva Studies in Emotion and Communication, 1(1), pp.1–98.

Schumacker, R. and Lomax, R., 2010. A Beginner’s Guide to Structural Equation Modeling. 3rd ed. London: Routledge.

Sheldon, P., 1997. Information technologies for tourism. Wallingford: CAB International.

Sirakaya-Turk, E., Uysal, M., Hammit, W., & Vaske, J., 2011. Research Methods For Leisure, Recreation and Tourism. Cambridge: CAB International.

Uriely, N., 2005. The tourist experience: Conceptual developments. Annals of Tourism Research, 32(1), pp.199-216.

Influencing the touristic experience?

A study of tourists’ perception of Authenticity through Augmented Reality at Mozart’s Birthplace

by Gloria Karlein, Vivien Verb, Akanksha Varma and Fadja Gross

The purpose of this paper is to research possible links between augmented reality and authenticity. The motivation behind this research is hence, to explore and evaluate authenticity as well as augmented reality and the underlying theories, which are prominent in literature today. Authenticity and tourism are topics, which have been widely researched in previous years. However, there is not much known about augmented reality and authenticity in tourism at the present times. Furthermore, tourism being an economic and more importantly social sector of many societies around the world today, this research aims at shedding more light on the influence of technology usage (augmented reality) and on the consequential alteration of touristic perceptions at historical sights. In order to do so, a survey is conducted which aims at comparing two groups of tourists. One group is asked to utilize an app in order to answer the survey questions afterwards. The other group simply answers the survey without the prior utilization of the app. Authenticity may be seen as the core of this research. In order to capture its essence in this paper, it is crucial to comprehend that authenticity and inauthenticity “are no longer asymmetrical counter-concepts…” (Olsen, 2002). But that they should rather be seen as “fluid concepts that can be negotiated” (Cohen, 188; Squire, 1994).

Given the fact that one of the major associations usually made with Salzburg is Mozart, his birthplace is one of the most visited sites. In a city like Salzburg, where cultural heritage attracts tourists from all over the world the question of what tourists perceive as being  “authentic” in combination with technology usage, and more specifically augmented reality, arises. In order to answer this question, authenticity must first be defined and discussed (which will be done in the first part of this research). Another purpose of this study is thus to analyse the differences in how authenticity is perceived by tourists.

2016-02-29 08.24.20

Copy & paste for hotel mobile websites? Or: The power of screen sizes

A study of differences in usability and content perception on hotel websites regarding their mobile appearance on devices with different screen sizes

by Melanie Fraiss and Sofiya Iliycheva

This paper deals with the question of whether there are differences in perceived usability and content of a hotel website that can be derived especially from the usage of varying mobile devices. By means of RWD [responsive website design] website content is tailored to different devices. One and the same content is adapted to the screen size of a tablet or a mobile phone. Therefore the aim of the study was to find out whether it is still state-of-the art to have one website design with the same navigation tools, features and content and simply adjust it to the devices in order to reach customer satisfaction.

The empirical research was conducted by means of a true experiment and comprised a triangulation of eye-tracking, think aloud protocols and semi-structured interviews and was done in the context of “Generation Y”. According to Weiler (2004) the representatives of this generation are those who were born between 1980 and 1994 and therefore the first generation to grow up using electronic devices from an early age.

The findings show that users navigating the same hotel website on different mobile devices exhibit grave differences in usability and content perception. It was found in the course of the empirical study that designing one website with identical content and features to just adapt it to different screen sizes by means of RWD does not seem to be sufficient anymore in today’s experienced economy. In addition, it was concluded that mobile devices are perceived as devices for quick interaction and therefore induce impatience to users easily in case of usability issues. The findings are considered especially relevant for the hospitality industry. At the point of designing a website, the study implies to not only use RWD but to tailor content, features and navigation sophisticatedly to the different devices in order to make full use of the intrinsic potential.

Weiler, A. (2004): Information-Seeking Behavior in Generation Y Students: Motivation, Critical Thinking and Learning Theory. In: The Journal of Academic Librarianship, 31/1, 46-53.

2016-02-29 09.32.35