by Kimberly Abeng, Rene Lule, Brian Yerri and Zhamilya Zhukenova
1. INTRODUCTION
The internet affected tourism industry structure (Poon 1993; Sheldon 1997) in a way that rivalry among the existing competitors increased, while on the demand side, the internet introduced a much higher degree of transparency as well as lowering the switching costs (Porter, 1985). The internet empowered consumers or tourists to easily identify, customise and purchase tourism products (Buhalis & Law, 2008, p. 610). Due to the rich content from the Internet and increasing of online users, printed media and television advertisement are no longer able to persuade consumers who search for deeper and meaningful experience. This factor has caused an inadequacy in the traditional marketing approach (Hosany and Witham, 2009) as consumers are in search of experiences that dazzle their senses, engage them personally, touch their hearts and stimulate their minds (Schmitt, 1999).
Tourists’ experience has become an important topic in the tourism business as well as in the field of tourism research (Uriely, 2005) and for this reason it is vital for destinations to understand the issue of tourism experiences as that is what travellers are searching for (Neuhofer et al., 2012). Furthermore, not just “experience”, but “virtual experience” now considered as even more important for tourism industry, since online media is the main channel of informing potential customers of touristic products and offers nowadays (Eisenloeffel, 2013).
Consequently, this study seeks to investigate storytelling as a tool of enhancing online experience by triggering emotions and hence being the right instrument to use for tourism product providers.
1.1 Storytelling
The role of storytelling in tourism is looked at in different ways; the story “transforms an otherwise indifferent space into attractive tourist destinations” (Chronis, 2012, p. 445). The success of narrative presentation in tourism depends on the willingness and involvement of tourists who have this ability to participate actively in a storytelling experience as well as being co- creators of the tourism experience.
Storytelling offers individuals a means of escape as they try to take in the accounts and explanations embedded within, and therefore it can be said that tourism experiences have the ability to attain a symbolic status in lives of the tourists, as they create their worlds into a bigger picture through actions, attitudes and values (McCabe & Foster, 2008, p.195).
Destinations can be seen as storyscapes or business domains where narratives can be arranged and transformed through an interaction between the suppliers or producers and customers (Chronis, 2005).

1.2 Emotions
Being of such a high importance in our lives, emotions become the main target of marketing and advertisement strategies, as well as design strategies of products and services, since the buying decisions may be driven by emotions (Desmet, 2003). In relation to tourism, according to Kim & Fesenmaier (2014) “emotions play a pivotal role in shaping tourism experiences” (p. 1). Roseman, Spindle, and Jose (1990, p. 899), define emotions as “evaluations and interpretations of events, rather than events per se, [that] determine whether an emotion will be felt and which emotion it will be.” Scherer (1987) goes deeper and defines emotions as “an episode of interrelated, synchronised changes in the states of all or most of the five organismic subsystems in response to the evaluation of an external or internal stimulus event as relevant to major concerns of the organism” (p. 7). The stimulus event can be both external (good or bad news) and internal (dreaming).
2. METHODS
With the purpose of designing a robust and valid study, the researchers considered experiment to be the best research design. Furthermore, according to Berg (2000) greater research validity can be attained via recourse to triangulation. Therefore the methodological triangulation is applied and the qualitative part of the study is represented by the focus group.
The two hypotheses to be tested are:
H1: Storytelling triggers emotions
H2: The emotions triggered have an effect on webpage/online experience
In order to test H1 it is needed to study the correlation between the storytelling and emotions, the latter has to be measured in order to reveal the correlation. Limited by resources, researchers determined the self-report method of emotions measurement as the most appropriate. Withal, emotions measurement was built on the model by Plutchik (2001), where he systematised the primary emotions in a “wheel” (Figure 2). Namely, the eight primary emotions are contrasted to each other: joy-sadness, trust-disgust, fear-anger, surprise-anticipation. In order to measure experienced emotions, the 7-point Likert scale was used with the emotion pairs being at the extreme points of the scale. The H2 is tested by the correlation of satisfaction level with emotions, since studies by Babin & Griffin (1998) and Oliver (1997) as cited in Prayag et al. (2013) reveal that a positively perceived consumption experience results in satisfaction.
Figure 2. Wheel of Emotions. Source: Plutchik (2001).
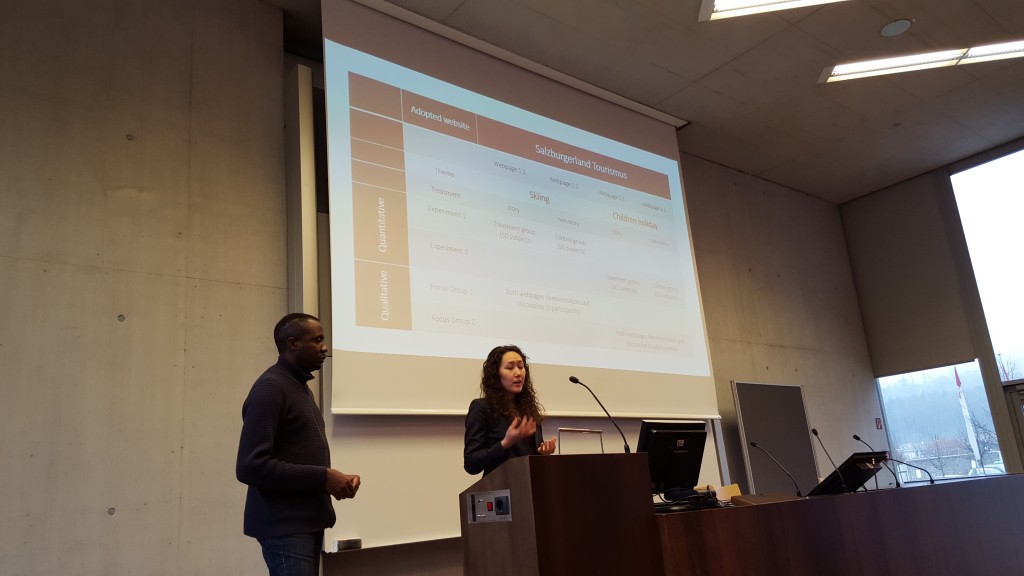
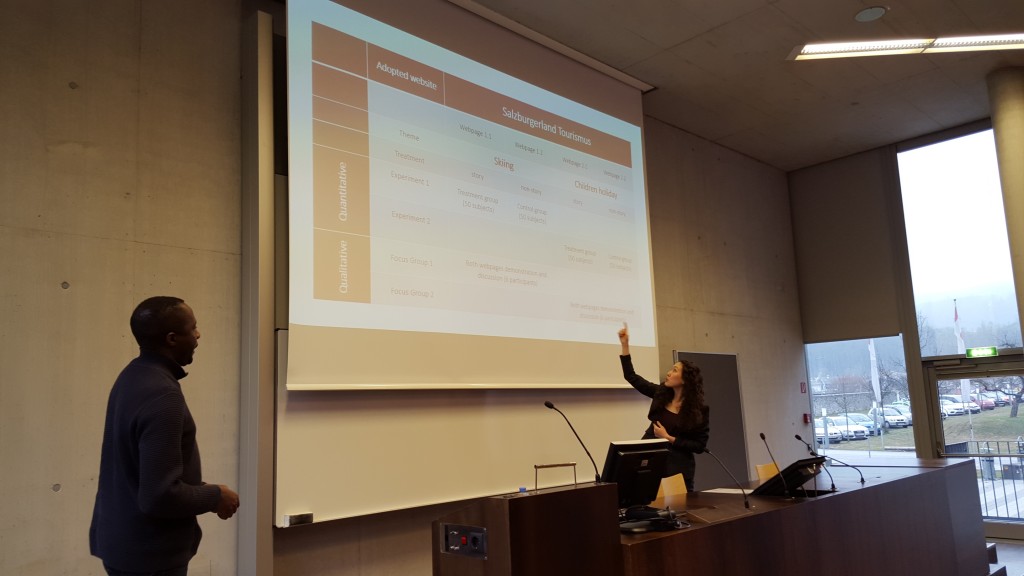
Then, the researchers have adopted a webpage of the DMO of Land Salzburg, Austria. The webpage was elaborated in four versions employing two themes with a story and a non-story element – video. The four videos employed in the study were selected from the total of eight videos, while the selection of videos and their designation to “story” or “non-story” category was made by twelve independent persons. Table 2 summarises the research approach of the current study as well as QR codes provide with direct link to the webpages and videos.
The quantitative part of the study employed the online self-completion questionnaires, where the respondents were asked to visit the adopted webpage of Salzburgerland Tourismus and to watch a video, after which they were asked to answer the questions. Within the qualitative framework, the focus groups were demonstrated the webpages of Salzburgerland Tourismus with both story and non-story videos. After that participants had a discussion of the videos and their emotional appeal.

2.1 Sample size and selection
The study used convenience sampling with university students as research subjects due to their availability and easy accessibility, a point also put forward by Bryman (2012) when explaining the choice of this type of sampling method.
An age range of between 18 – 35 years old was used considering the average age of students joining the university. The study stretches the minimum and maximum ages to 18 and 35 years respectively in order to cover the early and late beginners who are mainly working students (Pechar and Wroblewski, 2012).
The use of university student samples in experimental research has increased in the hospitality and tourism (Ok et al, 2008), as well as in the social psychology and consumer behaviour sectors. According Lynch (1982), the traits exhibited by students as research subjects are similar. In other words, the difference displayed by students within a scale is less and also more consistent across scales than that displayed by non-students (Peterson, 2001). This small variation displayed by student groups due to their homogeneity may transform into stronger hypothesis tests as compared to that in non-student groups (Peterson, 2001; Lynch, 1982).
Concerning the sample size, according to Ding, Velicer and Harlow (1995) (cited in Schumacker & Lomax, 2010) the agreed minimum of sample size structural equation modelling is 100 to 150 subjects. Hair et al. (1977) as cited by Sirakaya-Turk et al. (2011) argues that the sample size of 200 is sufficient for well-grounded estimation.
In this research, it has been decided to use a sample size of 200 participants. Limited time and resources of the research team do not allow increasing the sample size, while this figure still provides sound foundation for the study.
The size of the focus groups was defined as 6 persons per group. Although Morgan (1998a) as cited by Bryman (2004) argues that common size of focus groups is from 6 to 10 participants, he still suggests smaller groups in cases when higher members’ feedback on the topic needed.
3. FINDINGS
3.1 Experiment
In order to find out from the data collected whether the story videos triggered emotions, frequency tables were drawn and the results indicated that over 90% of the respondents felt emotions after watching story videos, while 52% and 30% felt emotions after watching the children’s and skiing holiday non stories respectively. It can, therefore, be said that the story videos triggered more emotions than the non-story videos.
In order to capture the views of all the respondents to the study, cross tabulations were made on whether one felt emotions and feelings towards the webpage and video, and feelings about the experience on the webpage and video. The correlation coefficient returned positive relationships, which indicate that the emotions felt had an influence on the respondents’ feelings and experience on the webpage. The video duration and feelings towards the webpage and video produced a weak positive relationship, which could imply that the length of the video had a minimal effect on the feelings towards the webpage and video. But when video duration was again cross tabulated with feelings about the experience on the webpage, the relationships produced was stronger than in the first instance.
3.2 Focus group
Each of the two focus groups was transcribed, coded and analysed by two researchers, so that the decisions about importance of certain issues would not be biased by opinion of one researcher. Table 3 presents the findings from both focus groups.
During the focus group interview, it appears that both story videos were perceived with positive emotions, compared to the other two non-story videos, which is due to the video content providing a good storyline, music. Respondents reported feeling of involvement and excitement. Creating a good video content able to assist online users in decision making and music play important role for emotion appeal. Therefore, a good camera perspective, high video quality and embedded with the right music are important components for first impression.
In contrast, the non-story videos were perceived negatively due to the video content being narrative and informative. Respondents also found this video is extremely boring due to the poor video quality, bad audio and longer perceived duration even though it has the same length as the story videos. They also added that these videos would not be their first choice when comes to searching holidays information.
4. CONCLUSION
This study contributes to understanding of how online experience can be enhanced by storytelling through triggering emotions. The emotions felt by participants were tested with reference to Plutchik’s wheel of emotions (2001) and in relation to the output data collected, it was evident that storytelling does have an effect on emotions which in turn have an influence on users’ online experience. In addition, the study discovered a significant positive correlation between video content and the feelings about the experience on the webpage and video. Most of the respondents who found the video content interesting expressed satisfaction with the webpage and had a good experience as well.
The study also found that online users would prefer to watch a video first, which gives them the interest to seek more information about a destination by reading text stories. Other factors influencing the online experience include websites design, colours, font, and easy navigation.
From the findings of the study it is evident that storytelling aids in triggering awareness and an imagination, it also triggers interest and desire, which all support destination image and its promotion. Room for further research would however be to find out how destinations can convert this already generated awareness, imagination, interest and desire into action at the bottom of the purchase funnel.
5. REFERENCES
Berg, B., 2000. Qualitative Research Methods for the Social Sciences. 4th ed. Boston: Allyn & Bacon.
Bryman, A., 2004. Social Research Methods. 2nd edition. Oxford: Oxford University Press
Bryman, A., 2012. Social Research Methods. 4th edition. New York: Oxford University Press.
Buhalis, D., & Law, R., 2008. Progress in information technology and tourism management: 20 years on and 10 years after the Internet—The state of eTourism research. Tourism management, 29(4), pp.609-623.
Business Insider, 2013. The Mobile Tourist: How Smartphones Are Shaking Up The Travel Market. [Online]. Available at: <http://www.businessinsider.com/the-mobile-tourist-how-smartphones-are-shaking-up-the-travel-market-2013-1?IR=T> [Accessed on 31 January 2013].
Chronis, A., 2005. Co-constructing heritage at the Gettysburg storyscape. Annals of tourism research, 32(2), pp.386-406.
Chronis, A., 2012. Tourists as Story-Builders: Narrative Construction at a Heritage Museum. Journal of Travel & Tourism Marketing, 29 (5), pp. 444-459.
Desmet, P., 2003. Measuring Emotions: Development and Application of an Instrument to Measure Emotional Responses to Products. In: Blythe, M.A., Overbeeke, K., Monk, A.F., Wright, P.C., eds. 2003. Funology: From usability to enjoyment. Springer Netherlands. pp.111-123.
Eisenloeffel, J., 2013. Principles of Imagineering: A Conceptual Framework to Enhance Virtual Experience on Touristic Websites. MA. Salzburg University of Applied Sciences.
Hosany, S., & Witham, M., 2009. Dimensions of cruisers’ experiences, satisfaction, and intention to recommend. Journal of Travel Research, 49(3), pp.351-364
Kim, J., Fesenmaier, D. R., 2013. Measuring Emotions in Real Time: Implications for Tourism Design. In: Xiang Z., Tussyadiah I., Proceedings of the Information and Communication Technologies in Tourism, Dublin, January 2014. Switzerland: Springer.
Lynch Jr, J. G., 1982. On the external validity of experiments in consumer research. Journal of consumer Research, 9 (3), pp.225-239.
McCabe, S., and Foster, C., 2006 .The role and function of narrative in tourist interaction. Journal of tourism and cultural change, 4 (3), pp. 194-215.
Neuhofer, B., Buhalis, D., Ladkin, A., 2012. Conceptualising technology enhanced destination experiences. Journal of Destination Marketing & Management, 1(1–2), pp.36-46.
Ok, C., Shanklin, C. W., Back, K. J., 2008. Generalizing survey results from student samples: implications from service recovery research. Journal of quality assurance in hospitality & tourism, 8(4), pp.1-23.
Pechar, H., Wroblewski, A., 2012. Austria. Non-traditional students in the 2000s. In: Slowey, Maria/Schuetze, Hans G ed. 2012. Global Perspectives in Higher Education and Lifelong Learning. London/New York: Routledge. pp.25-42.
Peterson, R. A., 2001. On the use of college students in social science research: Insights from a second‐order meta‐analysis. Journal of consumer research, 28(3), pp.450-461.
Plutchik, R., 2001. The nature of emotions: Human emotions have deep evolutionary roots. American Scientist, 89, pp.344-350.
Poon, A., 1993. Tourism, technology and competitive strategies. Wallingford: CAB international.
Porter, M. E., 1985. Technology and competitive advantage. Journal of business strategy, 5(3), pp.60-78.
Porter, M. E., 2001. Strategy and the Internet. Harvard business review, 79 (3), pp. 62-79.
Prayag, G., Hosany, S., Odeh, K., 2013. The role of tourists’ emotional experiences and satisfaction in understanding behavioral intentions. Journal of Destination Marketing & Management, 2(2), pp.118-127.
Roseman, I. J., Spindle, M. S., & Jose, P. E., 1990. Appraisals of emotion-eliciting events: Testing a theory of discrete emotions. Journal of Personality and Social Psychology, 59(3), pp.899–915.
Scherer, K. R., 1987. Toward a Dynamic Theory of Emotion: The Component Process Model of Affective States. Geneva Studies in Emotion and Communication, 1(1), pp.1–98.
Schumacker, R. and Lomax, R., 2010. A Beginner’s Guide to Structural Equation Modeling. 3rd ed. London: Routledge.
Sheldon, P., 1997. Information technologies for tourism. Wallingford: CAB International.
Sirakaya-Turk, E., Uysal, M., Hammit, W., & Vaske, J., 2011. Research Methods For Leisure, Recreation and Tourism. Cambridge: CAB International.
Uriely, N., 2005. The tourist experience: Conceptual developments. Annals of Tourism Research, 32(1), pp.199-216.